The Objective
Let it be any Application Server you use such as Weblogic, Websphere, Tomcat, Jboss, Glassfish. (or) Let it be any Java framework or architecture your web application is developed in like Spring MVC, EJB, JSF, DAO.
When it comes to administrating the Java (J2EE) application ( WEB or Enterprise EJB), we as developers (or) Administrators always be cautious of performance issues.
One of the excruciating performance issues we face in production is that our application is eating a lot of the System Resources like Memory and CPU.
If you are the developer, you will be like "What the heck!. Everything was perfect across all other environments. Why PROD? Why Now ?"
If you are the Administrator, you will be like "Ohh man. Seriously ?. Why do they have to do their development and testing in PROD environment.? "
Never-ending Ball Game, it is.
But there is a common question both of you ask
Which Java thread is consuming all these CPU resources?
Well, That's the Objective of this Post. So let us see how to find Java High CPU consuming threads using Java Thread Top
The Answer and How to find it?
Well, the answer to the question of why this is happening can be as simple as a Simple Mistake in a code (or) Something multifold which may even require the dismantling of the entire application and days of debugging.
Peace!.
We have a tool for you to find Which Java thread is causing the High CPU Utilization but only if you are the species of the Linux world. ( too much exaggeration, is not it! I love Linux)
Enough of Jabbering.
Meet The Java Thread Top - A Shell Script-based Tool
Honestly speaking. It is really not First Principle (or) one of its kind type of tool where we have written anything new or original
We have just improvised the already available tools such as top, jcmd and wrapped them together so that it can serve some ultimate purpose ( or just simply taste good)
Here is the final recipe would look like.
Since I have already said its a collective script of various commands. Let us see the prerequisites
Prerequisites
- You must run Linux based os
- The bash shell is important
- the jcmd tool must be there
- the top command with batch sort support. ( >= version 3)
- cat (or) less would just be fine
Some Cases where JavaThreadTop can be helpful
- Linux High CPU utilization issue caused by Java-based Application server instance (weblogic, WebSphere, JBoss, Tomcat )
- Any Java Application runs on Linux platform is performing poor
- Java Web Application (or) Java EJB Enterprise Application is having slowness.
- When you want to Debug High CPU using Java Web or Enterprise Application
- When you want to know, Which Java Web or Enterprise Application threads are consuming more CPU and identify the actual thread name including the Java File Name along with Stack Trace information.
How to use
Step1: Copy the Shell script to your local and save it in some directory
Step2: Make sure it has execution privilages
Step3: Just ps -eaf and be ready with your JVM ( Java Virtual Machine) or Application server instance PID
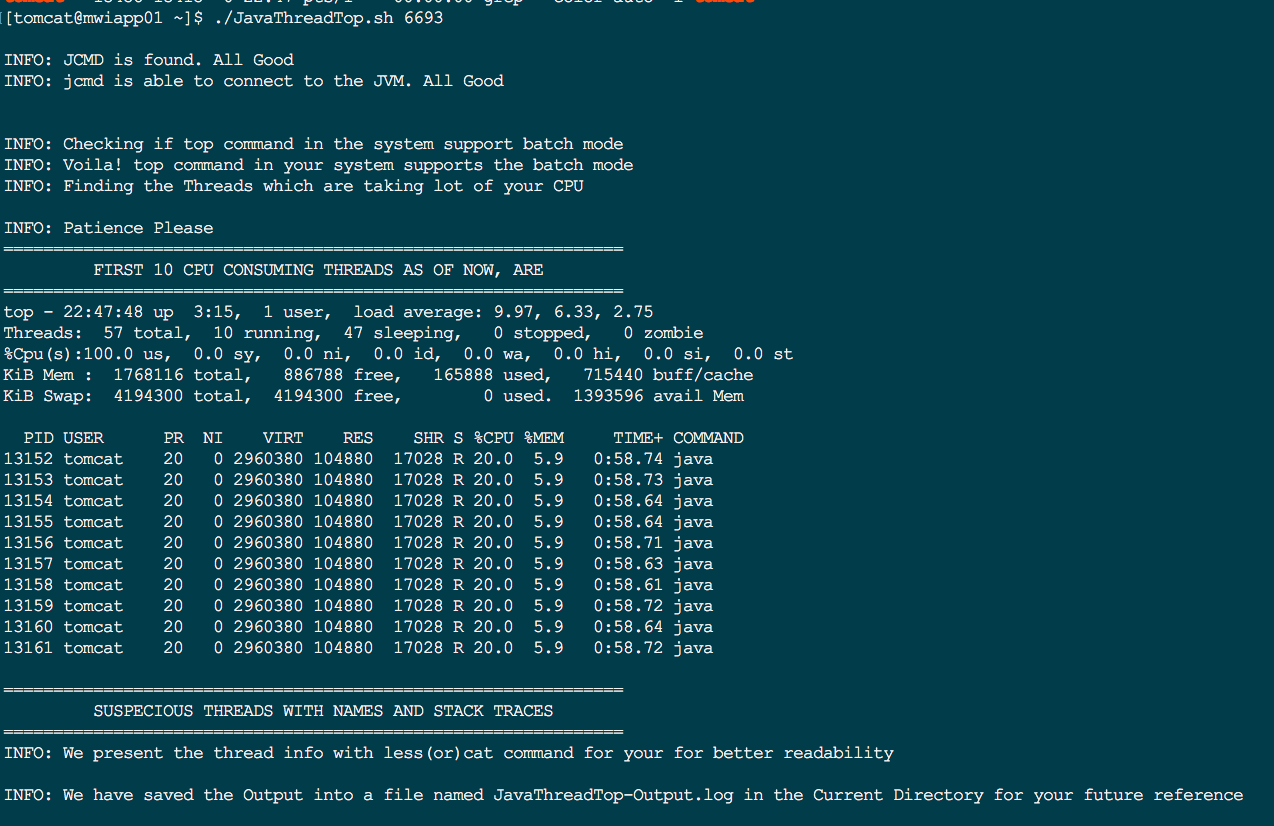
Step4: Start the script with the JVM's PID as a startup argument. Something just like this
./JavaThreadTop.sh 6693
Where to Download?
The Code and the execution output along with some sample log produced by Java Thread Top is available in our GITHUB PAGE
Trial Run - Java Thread Top in Action.
I honestly believe, "The best marketing of a tool should be of examples on what it can really do". So Let us quickly see this video of Java Thread Top - in Action.
Conclusion
Nothing much. Same things all over again. ( In fact, I should consider templating it )
- Hope it helps.
- Let us know your feedback by comments
- Share it with your fellow colleagues and friends if you like this post and tool.
- Contact me over comment for any help or queries
- Let me know how good this article is by giving a star rating [ratings]
Thanks
SaravAK

Follow me on Linkedin My Profile Follow DevopsJunction onFacebook orTwitter For more practical videos and tutorials. Subscribe to our channel
Signup for Exclusive "Subscriber-only" Content


